
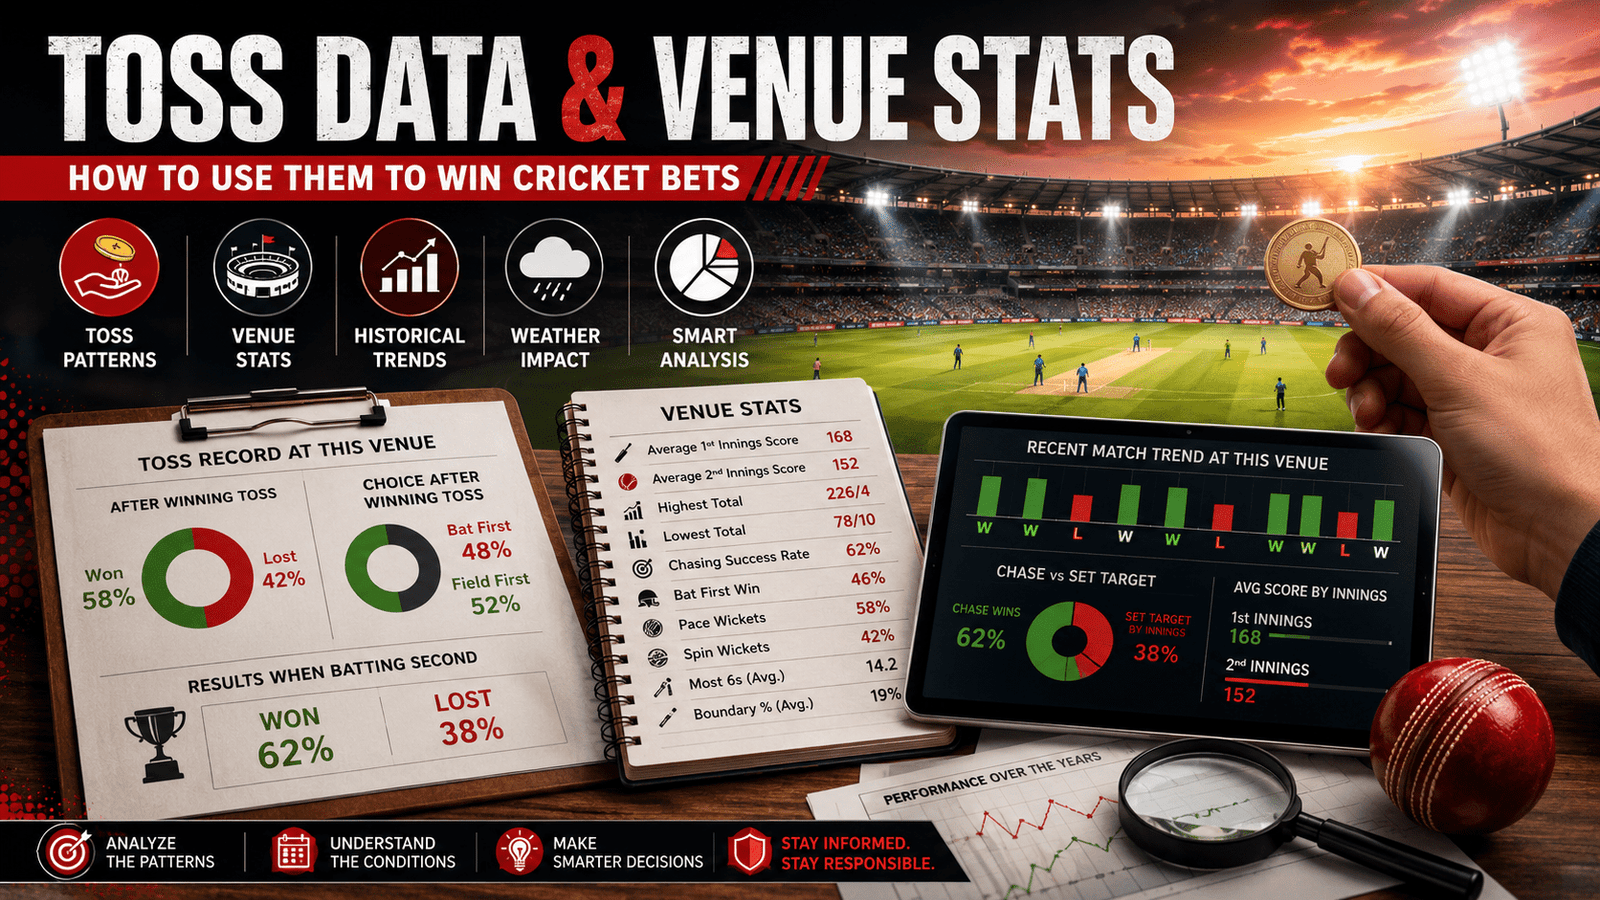
A cricket match can change quickly. A team that looks stronger on paper may struggle because of a slow pitch. A good batting side may become much more dangerous when chasing under lights. Even the toss can influence how teams approach the game.
This is why many experienced cricket followers study toss data and venue stats before analysing a match.
However, these numbers should not be treated as a guarantee of a result. Toss records, pitch history, weather, team combinations, and recent form are only parts of a much bigger picture. The real value comes from understanding how different pieces of information fit together.
In this guide, we will explain how to use toss data and venue statistics for cricket betting analysis, what numbers matter most, how to avoid misleading trends, and why historical data should always be combined with current match information.
What Are Toss Data and Venue Stats in Cricket?
Before using these numbers, it is important to understand what they actually tell you.
Toss Data
Toss data may include:
- How often a team wins the toss
- How often a captain chooses to bat or field
- Results after winning the toss
- A team’s record when batting first
- A team’s record when chasing
- Whether the toss has historically influenced results at a venue
Toss information can provide context, but it is not a prediction by itself. Winning the toss does not automatically mean a team will win the match.
Venue Stats
Venue statistics describe how cricket has historically been played at a particular ground.
Common venue data includes:
- Average first-innings score
- Average second-innings score
- Highest and lowest totals
- Chasing success rate
- Results when teams bat first
- Pace and spin effectiveness
- Powerplay scoring patterns
- Boundary frequency
- Dew and weather influence
The most useful analysis combines toss information with venue conditions rather than studying either factor in isolation.
Why the Toss Can Matter in Cricket Analysis
The toss can influence the tactical starting point of a match.
For example, a captain may choose to field first when:
- The pitch is expected to become easier for batting later
- Dew is likely during the second innings
- The ground has historically produced successful chases
- The opposition has a strong bowling attack but weaker batting depth
On the other hand, batting first may be preferred when:
- The pitch is expected to slow down
- The venue has a strong first-innings record
- The weather may become difficult later
- The team wants to set a target under scoreboard pressure
The key point is that the toss creates an opportunity or tactical advantage, not a guaranteed outcome.
A Cricket Fan Learned the Hard Way That Toss Data and Venue Stats Are Not the Whole Story
A few months ago, I came across an interesting cricket match experience that someone had shared with one of our colleagues. He was not a complete beginner. He followed cricket regularly, checked team news, watched matches closely, and believed he had learned how to read the numbers behind a game.
What happened next made him rethink the way he used toss data and venue statistics.
Before an important T20 match, he started analysing the game several hours before the first ball. He looked at recent team form, previous meetings, player performances, and the venue’s historical record. He was especially interested in one particular statistic: teams batting second had won most of the recent matches at that ground.
The pattern looked convincing.
The venue had a reputation for becoming easier to bat on later in the evening. Dew was also common during night matches. The chasing team had performed well in several recent games, and the team he was following had a strong record when batting second.
Then came the toss.
The team he expected to win the toss did not win it. The opposing captain won and chose to field first.
At that moment, the numbers seemed to make the situation even more interesting. The toss decision appeared to match the historical venue trend. The ground had produced successful chases before, and the captain had chosen the option that many people expected.
He later mentioned that, at that point, it felt like the match was almost following the statistics exactly.
But cricket rarely follows a script perfectly.
The first innings began, and the pitch behaved differently from what he had expected. The ball was not coming onto the bat as easily as it had in some previous matches. The batters struggled to score freely during the powerplay, and the team batting first finished with a total that looked below the usual venue average.
At first, he thought the chasing team would still have a comfortable opportunity.
After all, the historical numbers supported the chase.
But then he began noticing something he had not considered carefully enough before the match. The previous venue statistics included games played under different conditions. Some had taken place during the afternoon. Others involved different teams and different pitches. The recent matches had also included several very strong batting line-ups.
The number looked useful, but the full story behind the number was more complicated.
During the second innings, the expected advantage of chasing never really appeared. The pitch became slower, and the bowlers who could vary their pace started causing problems. The chasing team lost early wickets and never built the partnership it needed.
The team batting first eventually won.
After the match, he went back through his analysis. This time, he looked at the numbers differently.
He realised that he had not made one huge mistake. His research was not completely wrong. The problem was that he had allowed one attractive trend to become more important than everything else.
He had seen:
- A strong chasing record at the venue
- A common pattern of captains choosing to field first
- A team with a good record while chasing
- A history of evening matches affected by dew
But he had not given enough attention to:
- The actual pitch used for the match
- The current weather conditions
- The playing XI
- The quality of the bowling attack
- The format-specific sample size
- Whether older venue matches were truly comparable
When he later described the experience, one line stood out. He said that the statistics had not “failed” him. He had simply asked the statistics to answer a question they were never designed to answer.
That is an important lesson for anyone studying toss data and venue stats in cricket betting.
A toss can influence a captain’s decision. A venue can create recurring patterns. A chasing record can provide useful context. But none of these factors can guarantee what will happen in a particular match.
The most useful approach is to treat the data as part of a wider investigation.
Look at the toss. Study the venue. Check the pitch, weather, team selection, recent form, and match format. Then ask whether the historical trend still makes sense under the current conditions.
The experience also changed the way he approached cricket analysis. Instead of searching for one statistic that supported his first opinion, he began looking for information that could challenge it.
That small change made his analysis more balanced.
And perhaps that is the real value of toss data and venue statistics. They are not shortcuts to certainty. They are tools that help cricket followers ask better questions, understand conditions more clearly, and recognise when a historical trend may not apply to the match in front of them.
How to Read Toss Data Properly
A common mistake is to look only at a team’s toss-winning percentage.
That number alone has limited value.
Look at Toss Decisions
A team may win the toss frequently but choose the wrong option for a particular venue.
Study:
| Question | Why It Matters |
| How often does the captain bat first? | Shows tactical preference |
| How often does the captain field first? | Shows confidence in chasing |
| What happens after each decision? | Provides useful context |
| Does the decision change by format? | T20 and Test tactics differ |
| Does the venue affect the choice? | Conditions are ground-specific |
A captain’s decision should be studied alongside the pitch, weather, format, and team composition.
Separate Toss Results from Match Results
This distinction is important.
A team can:
- Win the toss and lose the match
- Lose the toss and still win comfortably
- Win the toss repeatedly without gaining a meaningful advantage
- Benefit from the toss only under certain venue conditions
Therefore, avoid statements such as:
“This team always wins after winning the toss.”
Historical patterns can be useful, but small sample sizes often create misleading conclusions.
How Venue Stats Help Cricket Betting Analysis
Venue statistics often provide more useful context than general team records.
A team may have an excellent overall record but struggle at a particular ground because:
- The pitch does not suit its batting style
- Its bowlers are less effective in those conditions
- The boundary dimensions expose weaknesses
- The team has limited experience at the venue
Similarly, a team with an average overall record may perform well at a ground that suits its style.
The Most Important Venue Numbers
1. Average First-Innings Score
This gives a broad idea of the scoring environment.
However, always compare the average with the current format.
A venue may have:
- Different scoring patterns in T20s
- Different scoring patterns in ODIs
- Completely different conditions in Test matches
Do not mix statistics from different formats without adjusting for context.
2. Chasing Record
The chasing record can reveal whether teams generally find it easier to bat second.
But a high chasing success rate may be influenced by:
- Dew
- Short boundaries
- Strong teams winning tosses
- A high number of matches involving powerful batting sides
The number should therefore be treated as a starting point for analysis rather than a final conclusion.
3. Pace Versus Spin
Some venues offer more assistance to fast bowlers early in the innings. Others become increasingly useful for spin as the match progresses.
Consider:
- New-ball movement
- Bounce
- Grip from the surface
- Pitch deterioration
- Boundary size
- Batting conditions under lights
This information can help explain why a venue favours certain playing styles.
Toss Data + Venue Stats: How to Combine Them
The strongest analysis does not ask only:
“Who won the toss?”
It asks:
“What does the toss mean under these specific venue conditions?”
Consider this simple example.
Example Scenario
A T20 venue has historically shown:
- A high chasing success rate
- Regular evening dew
- An average first innings score of around 175
- Fast outfield conditions
- Strong batting performances under lights
If the team winning the toss chooses to field, the decision may be consistent with the historical conditions.
But that still does not guarantee victory.
The final analysis should also consider:
- Current team form
- Playing XI
- Injuries
- Bowling quality
- Recent batting performance
- Weather changes
- Match-up between the two teams
This is the difference between using data as context and treating data as a prediction machine.
A Practical Pre-Match Data Checklist
Before analysing a match, review the following:
Toss Checklist
- Has the captain historically preferred batting or bowling first?
- How successful has the team been after winning the toss?
- Does the team perform better when setting a target or chasing?
- Does the captain’s decision match the venue conditions?
Venue Checklist
- What is the average first-innings score?
- How frequently do teams successfully chase?
- Does the pitch favour pace or spin?
- Is there a noticeable difference between day and night matches?
- Does dew regularly influence evening games?
Current Match Checklist
- Are key players available?
- Has the playing XI changed?
- What is the team’s recent form?
- Are the conditions different from historical matches?
- Is the sample size large enough to trust the trend?
Why Sample Size Matters More Than One Interesting Statistic
One of the biggest mistakes in cricket data analysis is giving too much importance to a small sample.
For example:
- A team may have won all three previous matches at a venue.
- A captain may have won four consecutive tosses.
- A ground may have produced three successful chases in a row.
These facts may sound significant, but they may not represent a reliable long-term pattern.
A better approach is to ask:
How many matches are included in the data?
A trend based on 30 or 40 comparable matches is generally more informative than a trend based on only three or four games. Even then, the quality of the data and similarity of the matches still matter.
Toss Data Should Not Be Used Alone
Toss data has a natural limitation: it is random.
A team cannot control whether it wins the toss. That means toss history should never be treated as a permanent team advantage.
Instead, focus on how the toss interacts with:
- Venue characteristics
- Weather
- Pitch behaviour
- Team strategy
- Player strengths
- Match format
For example, a toss may be more important at a venue where conditions change significantly between innings. At another venue, the toss may have very little practical impact.
Venue Conditions Can Change Over Time
Historical venue stats are useful, but cricket grounds are not permanently identical.
Conditions may change because of:
- Pitch preparation
- Weather patterns
- Ground renovations
- Boundary adjustments
- Changes in playing regulations
- Different ball behaviour
- Changes in the quality of teams playing there
This means a statistic from several years ago may not accurately describe current conditions.
Recent matches should usually receive more attention when the venue, format, and conditions are comparable.
How to Avoid Confirmation Bias
Confirmation bias happens when someone searches for statistics that support a decision already made.
For example:
- A person decides Team A will perform well.
- They search for statistics supporting Team A.
- They ignore data showing weaknesses.
- They become overconfident.
A better method is to analyse both sides.
Balanced Analysis Questions
Ask:
- What supports Team A?
- What supports Team B?
- Which statistics contradict the initial view?
- Are the trends based on enough matches?
- What could make the expected pattern fail?
This approach creates a more balanced understanding of the match.
Common Mistakes When Using Toss and Venue Data
Mistake 1: Treating the Toss as a Guaranteed Advantage
Winning the toss does not equal winning the match.
Mistake 2: Using Old Venue Records Without Context
Historical data may become less relevant when conditions, teams, or pitch preparation change.
Mistake 3: Mixing Formats
T20, ODI, and Test statistics should not be treated as interchangeable.
Mistake 4: Ignoring the Playing XI
A venue may favour spin, but the team may not have its best spinners available.
Mistake 5: Relying on One Statistic
No single number can fully explain a cricket match.
Mistake 6: Ignoring Weather
Rain, humidity, wind, and dew can change the expected match conditions.
Mistake 7: Confusing Correlation With Causation
A team may have a strong record after winning the toss, but that does not necessarily mean the toss caused every victory.
Toss Data vs Venue Stats: Which Is More Important?
There is no universal answer.
| Factor | Main Use | Limitation |
| Toss data | Shows tactical decisions and historical patterns | Toss outcome is random |
| Venue stats | Explains ground and pitch behaviour | Conditions can change |
| Team form | Shows recent performance | Short-term form can be misleading |
| Playing XI | Identifies current strengths and weaknesses | Final selection may change |
| Weather | Shows possible environmental influence | Forecasts can change |
The best approach is to combine all relevant information instead of searching for one “winning” statistic.
A Simple Data-Driven Match Analysis Framework
Use this five-step process:
Step 1: Identify the Format
Start by determining whether the match is a T20, ODI, or Test.
Step 2: Study the Venue
Review scoring patterns, chasing records, and bowling conditions for the same format.
Step 3: Check Toss Tendencies
Understand how both captains typically approach the toss.
Step 4: Add Current Information
Check team news, playing XI, injuries, recent form, and weather.
Step 5: Challenge Your Own Conclusion
Look for information that could disprove your initial view.
This final step is often ignored, but it can help reduce emotional and statistical bias.
Responsible Use of Cricket Data
Cricket statistics can improve understanding of the game, but they cannot remove uncertainty.
No toss trend, venue record, prediction model, or historical statistic can guarantee a result. Anyone presenting cricket data as a certain way to make money should be treated cautiously.
Readers should also consider the legal and regulatory position of online activities in their own location and use only services that are lawful and appropriate for them. Financial decisions should always be made carefully, with clear limits and an understanding that losses are possible.
For readers researching digital cricket platforms and account-related services, the website’s broader guides on an online cricket ID, Cricket ID Provider, and best Cricket ID Provider provide additional background on the wider online cricket ecosystem.
Frequently Asked Questions
What is toss data in cricket betting analysis?
Toss data refers to historical information about toss results, captain decisions, and match outcomes after winning or losing the toss. It can provide context but cannot guarantee a future result.
Why are venue stats important?
Venue stats help explain how a particular ground generally behaves. They may show scoring patterns, chasing trends, bowling conditions, and differences between batting first and second.
Is winning the toss a major advantage?
The importance of the toss depends on the venue, format, weather, pitch, and match conditions. At some grounds, it may have a meaningful influence. At others, its impact may be limited.
Should I rely only on toss history?
No. Toss history should be combined with venue data, team form, player availability, playing XI information, and current weather conditions.
How many matches are needed to identify a venue trend?
No fixed number guarantees reliability. A larger sample of comparable matches is generally more useful than a very small recent streak.
Are venue statistics the same for every cricket format?
No. A ground can behave very differently in T20, ODI, and Test cricket. Always compare statistics with matches from the same format whenever possible.
Can historical data predict a cricket match?
Historical data can help with analysis, but it cannot predict a result with certainty. Cricket contains many variables, including individual performances, strategy, injuries, weather, and unexpected events.
What is the biggest mistake in using toss and venue data?
The biggest mistake is treating one statistic as a guaranteed prediction. The strongest analysis considers multiple factors and recognises uncertainty.
Conclusion
Toss data and venue stats can provide valuable context when analysing a cricket match. They help explain how captains make decisions, how pitches behave, whether chasing has historically been successful, and how different conditions may influence team strategies.
But data is most useful when it is used carefully.
A toss-winning record is not a guarantee. A venue trend is not permanent. A high-scoring ground can produce a low-scoring match. And a team with a strong historical record can still struggle when the current playing conditions are different.
The most reliable approach is to combine toss information with venue history, format-specific statistics, current team news, playing XI updates, weather, and recent performance. Use historical numbers to ask better questions—not to assume that the future must repeat the past.
When analysing cricket data, informed and responsible decision-making is always more valuable than chasing certainty where none exists.