
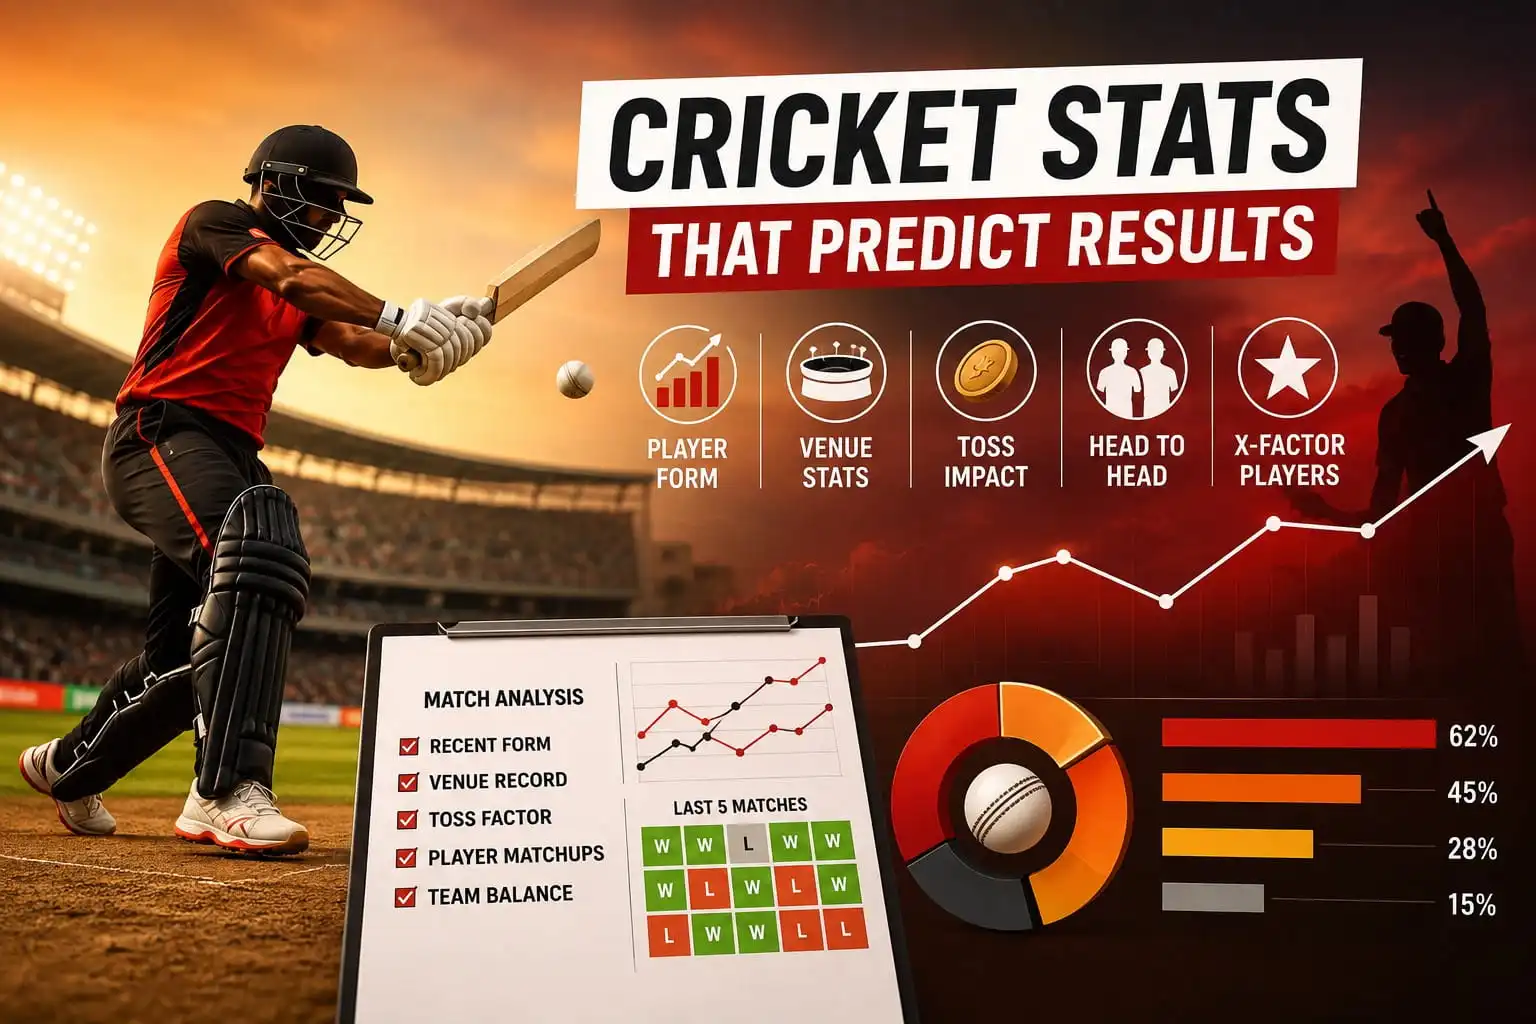
A cricket scorecard can show hundreds of numbers, but not every statistic helps you understand what may happen next.
A batter may have scored 500 runs this season, yet that number alone does not tell you how they perform against a particular bowling attack. A team may have won its last five matches, but those victories may have come against weaker opponents. Similarly, a bowler’s impressive economy rate may look less useful when you consider the venue, pitch conditions, opposition quality, and phase of the innings.
This is why learning how to read cricket betting stats to predict results is not about finding one magical number. It is about combining relevant data and understanding the context behind it.
In this guide, we will break down the most useful cricket statistics, explain which numbers deserve more attention, show how to compare teams and players, and highlight common mistakes that can lead to poor conclusions.
Important: Cricket statistics can improve analysis, but they cannot guarantee a match result. Cricket remains uncertain, and past performance is not a promise of future outcomes. Always consider local laws and use responsible decision-making.
What Cricket Statistics Can Actually Tell You
Statistics are most useful when they answer a specific question.
For example:
- Is a team consistently strong in the powerplay?
- Does a batter struggle against left-arm pace?
- Does a bowling attack perform better under lights?
- Is a team’s recent form genuine or influenced by weaker opposition?
- Does a venue favour chasing teams?
- Can a particular matchup change the expected balance of a game?
The best analysis does not simply collect numbers. It connects those numbers to the conditions of the match.
A useful approach is:
Basic statistic → Context → Comparison → Match situation
For example:
Batter averages 45 runs → Against which teams? → Against which bowling styles? → At which venue and batting position?
That process gives a much clearer picture than looking at the average alone.
An Interesting Experience of Learning to Read Cricket Stats Before a Match
A cricket fan once shared an interesting experience about how he learned to read match statistics more carefully before making any predictions.
For a long time, he used to look at cricket statistics in a very simple way. If a team had won its last five matches, he assumed it was in excellent form. If a batter had scored hundreds of runs in a tournament, he believed that player would definitely perform well in the next match.
But after following cricket more closely, he realised that statistics are not always as simple as they look.
He remembered looking at a match where one team had won its previous five games. On paper, it looked like the stronger team. The other team had a mixed recent record, so he initially thought the result would be easy to predict.
Then he started looking at the details.
The team with five consecutive wins had mostly played against lower-ranked opposition. The other team had lost some matches, but several of those games had been against much stronger teams. When he looked more closely at the statistics, the difference between the two teams was not as large as the basic win-loss record suggested.
That was the first time he understood that cricket betting stats to predict results should not be based on one number alone.
He then started looking at other details. He checked how both teams performed during the powerplay, how many wickets they usually lost early, and how well their bowlers performed during the final overs.
He also checked the venue.
The match was being played at a ground where teams batting second had performed well in recent matches. The pitch was known to become easier for batting later in the game. This information gave him a completely different view of the match.
He also looked at individual player statistics. One of the batters had scored more than 400 runs during the season. At first, that looked impressive. But when he checked further, he noticed that the player had struggled against left-arm pace, while the opposition had two experienced left-arm fast bowlers.
This did not mean the batter would definitely fail. Cricket does not work that way. But it showed him a possible matchup that was worth watching.
He also learned not to rely too much on head-to-head statistics. He once saw a statistic showing that a batter had scored heavily against a particular bowler. However, the record was based on only a small number of deliveries. The players had also faced each other several years earlier.
That made him understand the importance of sample size and context.
Now, whenever he looks at cricket statistics, he tries to follow a simple process. First, he checks recent form. Then he looks at the quality of the opposition. After that, he studies the venue, playing conditions, team balance, and important player matchups.
He also checks whether the key players are actually in the playing XI. A statistic is not very useful if the player is injured or not selected for the match.
The biggest lesson he learned is that there is no single statistic that can predict a cricket match. A high batting average, a strong recent record, or a good head-to-head record can all be useful. But each number needs to be understood in the right situation.
Today, he looks at cricket statistics differently. Instead of asking, “Which team has the better numbers?” he asks, “What do these numbers actually tell us about this specific match?”
That change in thinking helped him understand cricket analysis much better.
Statistics can provide useful information, but they cannot remove uncertainty from sport. A strong analysis combines data with context and always accepts that unexpected performances can change the result.
The Most Important Cricket Stats for Match Analysis
1. Recent Form: Useful, But Easy to Misread
Recent form is one of the first statistics many people check.
For a batter, this may include:
- Runs scored in the last 5–10 innings
- Number of 30+ or 50+ scores
- Average runs per innings
- Strike rate
- Dismissal patterns
For a bowler, useful recent numbers include:
- Wickets taken
- Economy rate
- Bowling average
- Dot-ball percentage
- Performance in different innings phases
However, recent form should not be treated as an automatic prediction.
A player scoring heavily in the last three matches may have faced weak opposition. Another player with low scores may have been dismissed by elite bowlers or played on difficult pitches.
Better question to ask
Instead of asking:
“Is this player in form?”
Ask:
“What type of form is this player showing, and does it match today’s conditions?”
That is a much stronger way to interpret recent performance.
2. Batting Average vs Strike Rate
These two statistics answer different questions.
| Statistic | What It Tells You |
| Batting Average | How many runs a batter typically scores before being dismissed |
| Strike Rate | How quickly a batter scores |
| Boundary Percentage | How often a batter scores through boundaries |
| Dot-Ball Percentage | How frequently a batter fails to score |
A high average may indicate consistency. A high strike rate may indicate scoring speed.
But the importance of each metric depends on the format.
In T20 cricket
Strike rate becomes extremely important because a slow innings can reduce the team’s scoring potential.
In ODI cricket
Both consistency and scoring speed matter. A batter may need to build an innings while maintaining a reasonable run rate.
In Test cricket
Average, time spent at the crease, dismissal patterns, and performance against specific bowling types may be more important than raw scoring speed.
The key lesson is simple:
Never judge a batter using only average or only strike rate.
3. Bowling Economy and Wicket-Taking Ability
A bowler’s economy rate shows how many runs they concede per over.
However, economy alone does not tell the full story.
Consider two bowlers:
| Bowler | Economy | Wickets |
| Bowler A | 6.2 | 8 |
| Bowler B | 7.5 | 15 |
Depending on the match situation, Bowler B may be more valuable because wickets can change the game.
Important bowling statistics include:
- Economy rate
- Bowling average
- Strike rate
- Wickets per match
- Dot-ball percentage
- Boundary percentage conceded
- Powerplay economy
- Death-over economy
- Performance against specific batting styles
A bowler who performs well in the middle overs may be more valuable in one match, while a strong death bowler may be more important in another.
4. Powerplay, Middle Overs and Death Overs
A team’s overall statistics can hide major strengths and weaknesses.
That is why breaking the innings into phases is so useful.
Powerplay
The powerplay often reveals:
- Opening batting strength
- New-ball bowling quality
- Early wicket-taking ability
- Boundary scoring ability
Questions to ask:
- How many runs does the team usually score in the first six overs?
- How many wickets does it lose?
- Does the opposition have strong new-ball bowlers?
- Do the openers struggle against swing or pace?
Middle Overs
The middle overs often show:
- Spin performance
- Batting rotation
- Partnership-building ability
- Ability to control the run rate
A team may have a strong powerplay but struggle badly against spin in the middle overs.
Death Overs
The final overs can decide limited-overs matches.
Useful statistics include:
- Runs scored per over
- Wickets lost
- Boundary percentage
- Death-over economy
- Yorker and slower-ball effectiveness
- Finishing ability
When analysing a match, comparing these three phases often gives more insight than looking at the overall team average.
How Head-to-Head Stats Should Be Used
Head-to-head statistics can be useful, but they are frequently overused.
For example, a batter may have scored heavily against a particular bowler in the past. But several things may have changed:
- The batter may have changed their technique.
- The bowler may have developed new variations.
- The matches may have been played in different formats.
- The sample size may be very small.
A record of 40 runs from 20 balls may look impressive, but it is not the same as a record built across 150 or 200 deliveries.
Check the Sample Size
Before relying on a head-to-head statistic, ask:
- How many balls or innings are included?
- Were the matches played recently?
- Were the conditions similar?
- Is the matchup relevant to today’s format?
- Has either player changed significantly?
A small sample can provide a clue. It should not become the entire analysis.
Venue Statistics: One of the Most Underrated Factors
The same team can perform very differently at different grounds.
Venue statistics may reveal:
- Average first-innings score
- Average successful chase
- Pace versus spin effectiveness
- Boundary size
- Dew influence
- Home-team advantage
- Batting performance during day and night matches
For example, a venue with a high average first-innings score may favour aggressive batting. Another ground may produce lower scores because the pitch slows down as the match progresses.
What to compare at a venue
| Area | Useful Question |
| Batting | What is the average score? |
| Bowling | Which bowling type performs best? |
| Chasing | Do teams batting second win frequently? |
| Toss | Does winning the toss create a measurable advantage? |
| Conditions | Does dew affect the second innings? |
Venue statistics should be used as context rather than treated as a guaranteed pattern.
Toss Statistics: Important, But Not Always Decisive
The toss can influence a match, particularly in limited-overs cricket.
However, the impact depends on:
- Pitch behaviour
- Weather
- Dew
- Format
- Ground conditions
- Strength of the two teams
A team may have a strong record after winning the toss, but that does not necessarily mean the toss itself caused every victory.
This is a common statistical mistake: confusing correlation with causation.
A better approach is to ask:
“Why does the toss appear to matter at this venue?”
If the answer is heavy dew during evening matches, then the data becomes more meaningful.
Team Strength: Look Beyond Win-Loss Records
A team’s win-loss record is useful, but it is incomplete.
Two teams can both have an 8–4 record while reaching that record in completely different ways.
Consider these additional factors:
- Average margin of victory
- Quality of opposition
- Batting depth
- Bowling depth
- Performance under pressure
- Record while chasing
- Record after losing early wickets
- Record when scoring first
Strength of Schedule Matters
A team that has won several matches against top-ranked opposition may be in a stronger position than a team with the same record against weaker teams.
Therefore, when comparing teams, ask:
Who did they beat?
Not just:
How many matches did they win?
Player Matchups That Can Change a Match
Modern cricket analysis increasingly focuses on specific player matchups.
Examples include:
- Right-handed batter vs left-arm pace
- Batter vs leg-spin
- Opener vs swing bowling
- Finisher vs slower balls
- Aggressive batter vs short-pitched bowling
These matchups can reveal weaknesses that general statistics hide.
For example, a batter may have an excellent overall average but struggle against a particular bowling style.
That does not mean the bowler will automatically dismiss the batter. It simply identifies a potential tactical area to watch.
How to Read Advanced Cricket Stats
Advanced statistics can provide deeper insight, but only when understood correctly.
Expected Runs and Expected Performance
Some analytical models compare actual performance with expected performance based on:
- Match situation
- Bowling quality
- Venue
- Over number
- Required run rate
- Wickets in hand
These models can help identify whether a player’s performance is genuinely exceptional or simply helped by favourable conditions.
Strike Rate by Match Situation
A batter’s overall strike rate may be less useful than their strike rate:
- During a required run rate above 10
- Against spin
- During the powerplay
- In the final five overs
- After the loss of early wickets
Context makes the statistic more meaningful.
A Simple Statistical Framework for Match Analysis
If you want a practical way to analyse a cricket match, use this five-step process.
Step 1: Check Recent Performance
Look at the last several matches, but avoid focusing on only one or two games.
Check:
- Runs
- Wickets
- Strike rates
- Economy rates
- Quality of opposition
Step 2: Compare Conditions
Study:
- Venue
- Pitch behaviour
- Weather
- Dew
- Day or night conditions
Step 3: Analyse Team Matchups
Compare:
- Top-order batting vs new-ball bowling
- Middle-order batting vs spin
- Finishers vs death bowling
- Team batting depth vs opposition bowling depth
Step 4: Look for Consistent Patterns
A pattern becomes more useful when it appears repeatedly.
For example:
- A team consistently loses wickets in the powerplay.
- A batter repeatedly struggles against a particular bowling type.
- A bowling attack regularly concedes heavily in the final overs.
Step 5: Identify Uncertainty
Good analysis also recognises what the numbers cannot predict.
Unexpected factors include:
- Injuries
- Tactical changes
- Weather interruptions
- An exceptional individual performance
- Pressure situations
- A sudden change in pitch behaviour
This final step is important because statistics should inform analysis, not create false certainty.
Which Cricket Stats Are Most Useful?
| Statistical Area | Usefulness | Why |
| Recent form | High | Shows current performance |
| Venue record | High | Explains environmental conditions |
| Player matchup | High | Identifies tactical strengths and weaknesses |
| Powerplay data | High | Shows early-innings patterns |
| Death-over data | High | Helps understand finishing and closing ability |
| Head-to-head record | Medium | Useful with a large, recent sample |
| Overall win percentage | Medium | Does not show match context |
| Toss record | Medium to low | Can be highly venue-dependent |
| One-match performance | Low | Sample size is too small |
Common Mistakes When Reading Cricket Statistics
Mistake 1: Looking Only at the Last Match
One match can be affected by:
- A dropped catch
- Rain
- An injury
- A poor pitch
- A brilliant individual performance
Use a broader sample.
Mistake 2: Treating Recent Form as Everything
Recent form matters, but long-term ability and conditions also matter.
Mistake 3: Ignoring Opposition Quality
Five wins against weaker teams do not always equal five wins against elite opposition.
Mistake 4: Using Head-to-Head Data Without Checking Sample Size
A tiny sample can create misleading conclusions.
Mistake 5: Ignoring the Playing XI
Statistics are meaningless if the player is injured, rested, or not selected.
Always check the confirmed lineup before making serious match analysis.
Mistake 6: Confusing Correlation With Causation
If a team wins more often after winning the toss, the toss may not be the only reason.
Other factors may include:
- Stronger teams winning more tosses and matches
- Venue conditions
- Weather
- Team quality
Mistake 7: Believing One Statistic Can Predict Everything
There is no single number that can accurately predict every cricket result.
A Practical Cricket Statistics Checklist
Before reaching a conclusion, ask:
Team Form
- How has each team performed recently?
- Who were the opponents?
- Were the matches played in similar conditions?
Batting
- Which players are scoring consistently?
- How quickly are they scoring?
- Does the middle order provide enough depth?
Bowling
- Who takes wickets early?
- Which bowlers control the middle overs?
- Which team has better death bowling?
Conditions
- What is the venue’s average score?
- Does the pitch favour pace or spin?
- Is dew likely to affect the second innings?
Matchups
- Are there important batter-bowler matchups?
- Does either team have a clear tactical weakness?
Uncertainty
- Are the statistics based on a large enough sample?
- Are there injuries or lineup changes?
- Could weather or pitch conditions change the match?
Why Context Is More Important Than Raw Numbers
Imagine a batter has an average of 50.
That sounds excellent.
But now add context:
- The player has mostly played on flat pitches.
- The player struggles against left-arm pace.
- The upcoming match is at a difficult venue.
- The opposition has two strong left-arm fast bowlers.
The original average remains 50, but its predictive value may be different in this specific match.
This is the central principle behind meaningful cricket statistics:
A statistic becomes more useful when you understand the situation surrounding it.
The same principle applies to teams, bowlers, venues, and historical records.
Frequently Asked Questions
What are the best cricket stats for predicting match performance?
Recent form, venue performance, player matchups, powerplay statistics, death-over performance, batting depth, bowling quality, and opposition strength are among the most useful areas to study.
Can cricket statistics accurately predict match results?
No statistic can guarantee a result. Cricket contains significant uncertainty, and unexpected performances, weather changes, injuries, and tactical decisions can change a match.
Is recent form more important than long-term statistics?
Neither should be used alone. Recent form shows current performance, while long-term statistics provide a broader view of consistency and ability.
How important are head-to-head cricket statistics?
They can be useful when the sample size is large and recent. A small number of previous encounters should not be treated as strong evidence.
Should I always trust a team’s win percentage?
No. Win percentage should be considered alongside opposition quality, venue, match conditions, player availability, and the manner of victories and defeats.
Why are venue statistics important in cricket?
Different venues can favour different styles of batting and bowling. Pitch behaviour, boundaries, weather, dew, and ground dimensions can all influence performance.
Which is more important: batting average or strike rate?
It depends on the format and match situation. Average reflects consistency, while strike rate reflects scoring speed. Both should be considered together.
Can statistics predict an upset?
Statistics can sometimes identify situations where a supposedly weaker team has favourable conditions, strong matchups, or better recent performance than its overall reputation suggests. However, an upset cannot be guaranteed.
What is the biggest mistake when analysing cricket data?
The biggest mistake is relying on one statistic without considering context. Strong analysis combines several relevant metrics and also recognises uncertainty.
Learning how to use cricket betting stats to predict results is less about finding a perfect formula and more about asking better questions.
Do not look only at the last five matches. Do not rely entirely on head-to-head records. Do not assume that a high batting average automatically means a player will perform well in every situation.
Instead, combine recent form with venue conditions, player matchups, innings-phase performance, opposition quality, team balance, and confirmed lineups.
The most useful statistics are the ones that explain why a pattern exists.
Used carefully, cricket data can make match analysis more structured and less dependent on emotion or guesswork. But statistics remain tools for analysis, not guarantees of future results. Always consider the uncertainty of sport, applicable laws, and responsible decision-making before acting on any information.